Introduction
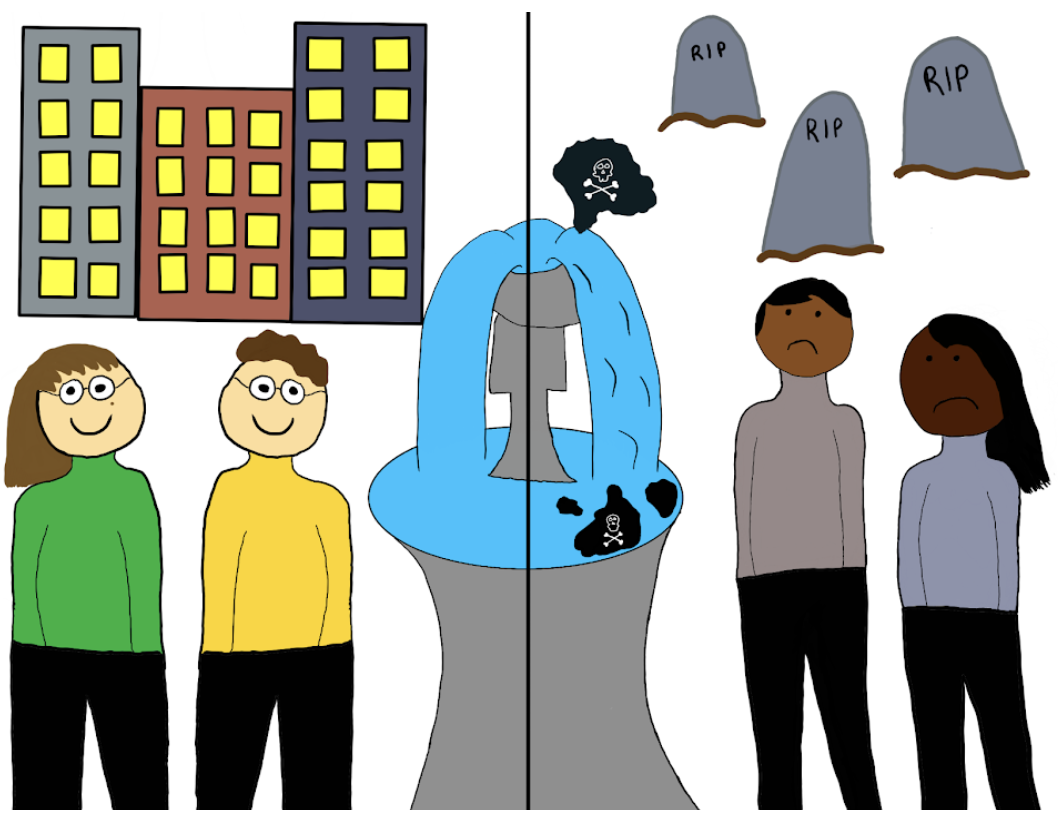
Access to safe drinking water, reliable public safety workers, and honest unbiased government should be a reality for everyone in the world. Unfortunately, a report published by NRDC found communities of color, low-income, more non-native English speakers, crowded housing conditions, and little access to transportation have higher rates of drinking water violations (Fedinick et al. 2019). Minority/low-income communities are often targeted for their lack of political and economic power, which makes it easy for more powerful groups to spread pollution in these areas that could affect their water sources (Bae and Lynch 2022). Several water systems are in violation of the Safe Drinking Water Act by not reporting, monitoring or advising the public of the unsafe drinking water that could cause health risks due to dangerous contaminants in the drinking water. Many serious health problems are caused by contaminants in drinking water (Fedinick et al. 2019). Being subjected to these pollutants through drinking water can cause major health problems like cancer, asthma, etc. as well as in some extreme cases death. The rates of these health problems often occur more in minority/low-income communities (Fedinick et al. 2019).
The disadvantage of these communities is due to race, wealth, political injustice, and economic injustice. Wealth is a big part of why some of these Safe Water Drinking Act violations are happening. This is because wealthy communities are more likely to get the funding for necessary procedures for access to safe drinking water. The US drinking water foundations are usually affected by profit-driven water industries, instead of being affected by the equitable distribution of clean drinking water/resources (Bae and Lynch 2022). While low-income communities are underfunded and don’t get easy access to safe drinking water. These minority/low-income communities were historically formed by discriminatory practices such as racial segregation.
For instance, racially segregated housing patterns lead to minorities being put into one area that can be discriminated against economically, politically, and socially (Bae and Lynch 2022). Since these communities lack economic and political representation, they are often taken advantage of by public officials who would put toxic sites in these communities (Bae and Lynch 2022). So, these communities are then subject to more Safe Drinking Water Act violations which could lead to health risks. Overall, these communities that were historically discriminated against have greater safe drinking water violations due to racial, political, and economic injustices.
Safe Drinking Water Rules/ Violation
The Safe Drinking Water Act (SDWA) was put in place to protect communities from approximately 100 water contaminants. According to SDWA, public water systems that serve 25 people and more are required to adhere to containment regulations set by the EPA such as regular contaminant testing to ensure contaminant levels do not exceed the maximum contaminant level (MCL) (EPA 2021). MCLs are contaminant thresholds that incorporate real-world issues such as technical clean-up and financial restrictions to maximum contaminant level goals (MCLG) (EPA 2021). When contaminants in drinking water exceed MCLGs, they can cause serious health risks to the communities that rely on those water systems.
Categories of Health-based Violations:
1) Exceeding maximum contaminant levels
2) Exceeding maximum residual disinfectant levels
3) Noncompliance with treatment technique requirements
(EPA 2022)
Table 1. Common health-based violation 2016-2019 data sourced from NRDC: Watered Down Justice Report 2019.
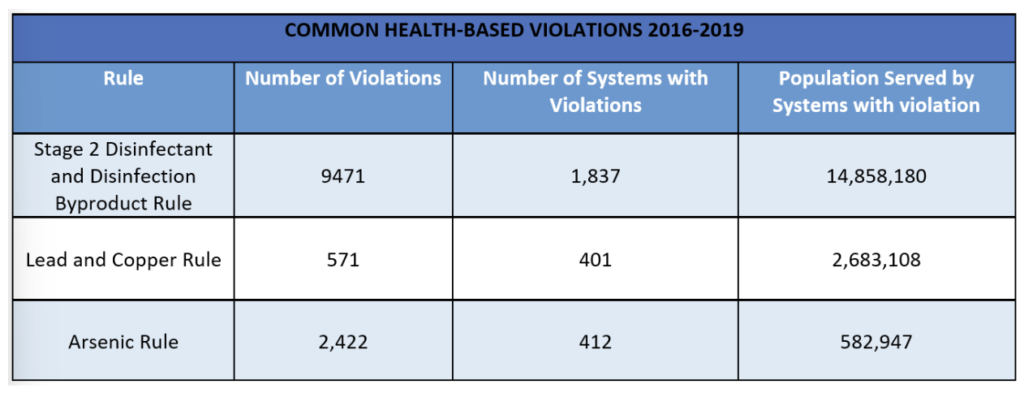
The Watered Down Injustice Report identified 23,040 health-based violations of the SDWA during a 3-year period (Fedinick et al. 2019). Meaning 44,980,846 people were regularly drinking water from systems violating the safe drinking water act and at serious health risk (Fedinick et al. 2019). For this article, we have focused on just a few of the relatively common and dangerous health-based violations listed in table 1. Violation of maximum contaminant levels of lead, copper, arsenic, and disinfectants or their by-products means the drinking water contains unsafe levels of these pollutants. Communities drinking from water systems in violation of the MLC regulations are drinking contaminated water and at higher risk of contaminant toxicity.
The following major rules and requirements are important for monitoring MLCs and informing the public of drinking water contamination but do not fall under health-based violations because they do not directly affect human health.
Monitoring requirements established in the SDWA require states to regularly report inspections, surveys, and plans for improvements to the EPA. Monitoring requirements ensure the integrity of the water systems, and facilities that ensure contaminants are properly removed from the drinking water. Failure of these monitoring requirements can result in drinking water contamination and community health risks.
Public Notification Rules in the SDWA require notice alerts when the water does not meet drinking standards such as exceeding MLCs, failure to test, cheaper technology being used, and after an exemption is issued due to failure to meet new regulations (EPA 2000). In 2001 this section of SDWA was revised. Now public notices are required within 24hrs, 30 days, or 1 year depending on a 3-tier violation system (EPA 2022). The revision lists violations of exceeding maximum contaminant levels of several pollutants under tier 2 meaning people drinking water from systems exceeding MLCs are drinking contaminated water without knowing for 30 days (EPA 2022). As we discussed above, exceeding MCLs means the water is contaminated with levels above observed negative health impacts. Water systems violating public notification rules may be exposing communities they supply to dangerous levels of contaminants for longer periods of time without the community knowing.
An NRDC Report found a total of 170,959 violations of SDWA Nationwide from 2016 – 2019 These violations include health-based (MLCs), monitoring requirements, and public notification rules (Fedinick et al. 2019). Using EPA violation data along with The Social Vulnerability Index (SVI) NRDC found drinking water violations such as exceeding MLCs, long-term noncompliance, and weak enforcement of safe drinking water occur at higher rates by water systems serving counties with the highest minority vulnerability and non-english speaking language vulnerability (Fedinick et al. 2019). SVI uses census data to rank how vulnerable a county is too hazardous events dependent on their estimated ability to respond (Hallisey, Flanagan et al.). SVI incorporates socioeconomic status, household composition & disabilities, minority status & language, and housing & transportation (Hallisey, Flanagan et.al). The correlation found with longer noncompliance time and higher violations to vulnerable minority counties compared to counties with lower numbers of minorities highlights the disproportional weight of health risks these communities face.
Cases of Environmental Injustice in Drinking Water and Health Risks
Water crisis has been all over the world, specifically in places where poverty is prominent. An example of this is the water issue that is happening in Flint, Michigan. It was reported that thousands of residents that are mostly minorities and the less privileged had been exposed to multiple contaminants (EPA 2000). But that also goes to the whole country– According to NRDC in 2017, Almost 25 percent of the U.S population was in violation of the Safe Drinking Water Act (SDWA). That is 77 million people that are affected by polluted drinking water, especially in underserved and vulnerable communities (EPA 2000). It was mentioned that the federal law has planned to make sure that all Americans have access to clean drinking water that does not violate MLCs.
Covered below are some examples of Environmental Injustice Cases where the pollutant levels exceed the MCLs in drinking water in communities with higher proportions of minorities or higher levels of poverty. As seen in Table 1 health-based violations involving lead, arsenic, and disinfectants and their byproducts are common and often go long periods of time in non-compliance. These contaminants also pose severe health risks to those who consume levels exceeding MLCs. Here we will dive into those health effects and the communities they have affected disproportionately.
Lead in Park Water: Bryan, Texas
Park water in two Texas communities was found to be contaminated by lead concentrations that are posing a threat to the people. In 2021 a study was done at every public park from Bryan, TX to College Station, TX (N=56). Each park had water sampled and tested for the presence of lead. In the study, neighborhoods below the average income of this area were twice as likely to have detectable levels of lead, and 1.5 times the average concentration. In Bryan, 57.2% of residents are minorities, with 22.6% of the population being in poverty. In College Station, 33.4% of residents are minorities, and 30.8% of the total population is in poverty. Out of the 56 parks tested, 21.4% of drinking fountains had detectable lead levels that were between 2 to 3.5 ppb (Fawkes 2021). Of the parks with an average lead concentration of 1.3 ppb across all sites, and the highest concentration of 8.0 ppb. According to the World Health Organization (WHO) in 2022, a decrease in children’s intelligence, behavioral issues, and learning problems can stem from lead concentrations as low as 3.5 ppb. The EPA has declared that the safe limit of lead in drinking water is zero, which means this violates maximum contamination levels.
Health Effects of Lead:
MCL(maximum contaminants levels): 0 ppb
MCLG(maximum contaminants goal): 0 ppb
(EPA 2022)
- Brain: can affect brain development (Lower IQ and behavioral issues) (EPA 2022).
- Heart: risk for heart disease (EPA 2022).
- Kidneys: risk for chronic kidney issues (EPA 2022).
- Reproduction: can cause preterm birth and low birth weight (EPA 2022).
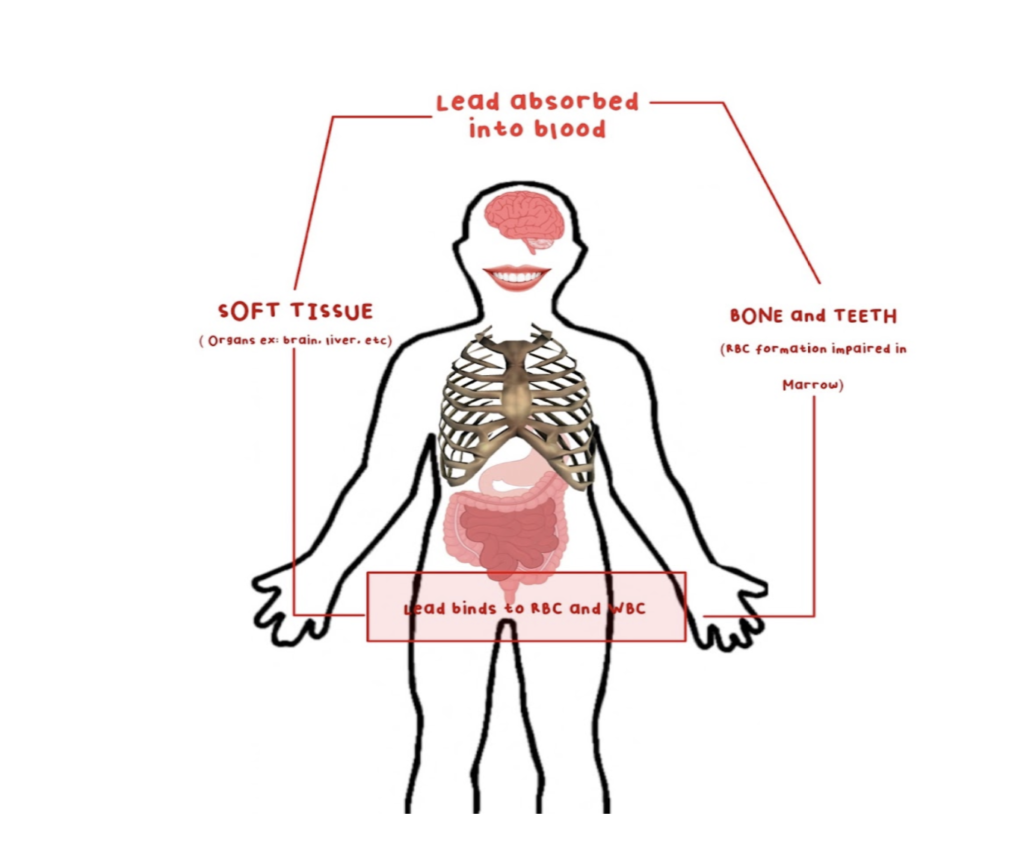
Figure 1. How Lead is absorbed into the body and what systems are involved. Figure by Shaina Llamas.
Arsenic in Drinking Water: San Luis Valley, Colorado
It’s been proven that consuming drinking water with over 500 ppb of inorganic arsenic is associated with type II diabetes mellitus (DM) in humans. Other high-level effects of arsenic according to the EPA include partial paralysis, blindness, numbness in extremities, and many types of cancers. This study focuses on lower drinking water levels of inorganic arsenic in San Luis Valley, CO. The poverty percentage in this area is 31.1%, or 207 of 665 people, which is much higher than the national average of 12.8%, making this an environmental injustice case. In San Luis Valley there were 595 groundwater wells tested for arsenic levels, and the data collected ranged from undetectable (<1 ppb) to 752 ppb, with an average concentration of 39 ppb (James 2013). According to the EPA, the standard of arsenic in drinking water is 10 ppb. This is a health violation of exceeding maximum contaminant levels. The results of this study show a significant relationship between inorganic arsenic exposure and the risk of type II DM in a lifetime exposure assessment, with 25.7%, or 141 out of 548 people, positive cases for type II diabetes mellitus (James 2013).
Health Effects of Arsenic:
MCL(maximum contaminants levels): 10 ppb
MCLG (maximum contaminants goal): 0 ppb
(EPA 2022).
- Brain & nervous system: Impaired cognitive development, reduction in brain weight, Deficit in intelligence and memory (EPA 2022).
- Lungs, Liver, Reproductive, Cardiovascular, Skin, Renal, Bladder, and Urinary Tract: Different kinds of cancers (EPA 2022).
- Endocrine: Diabetes (EPA 2022).
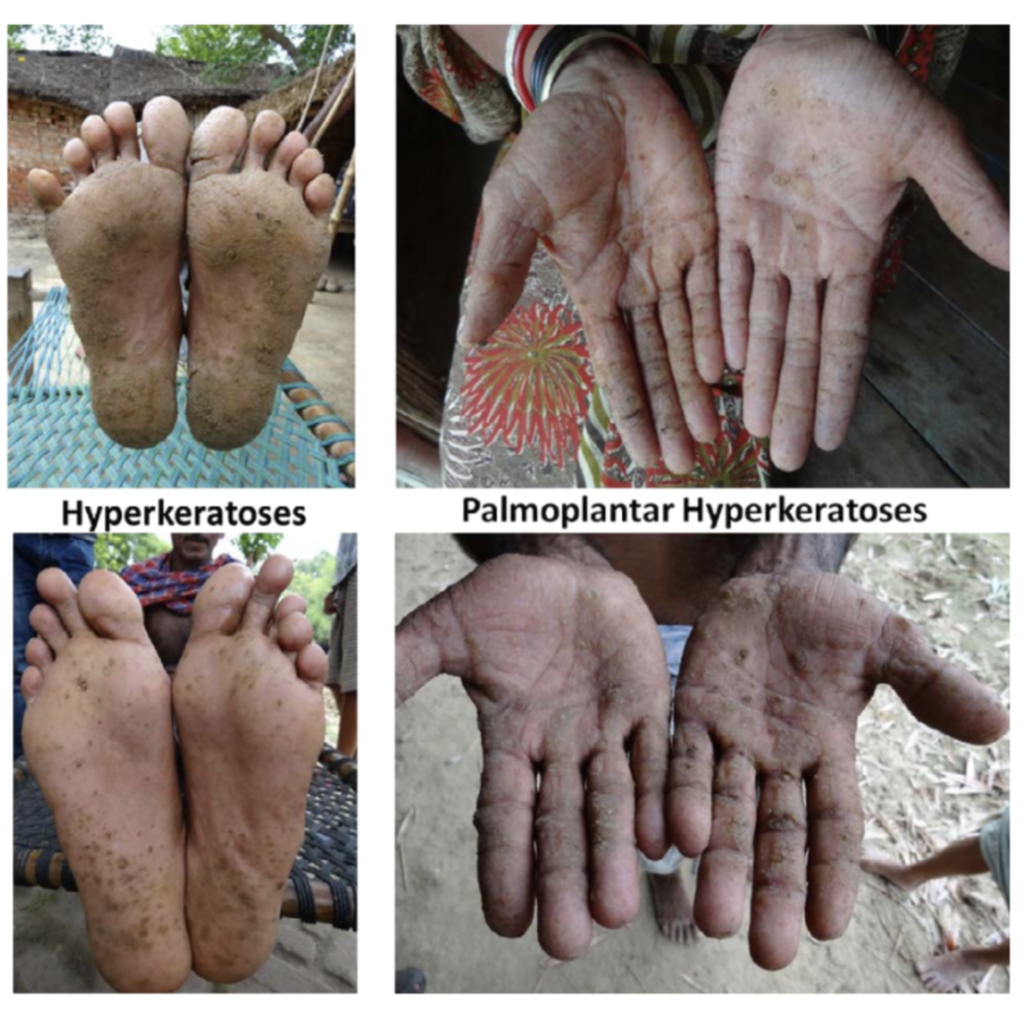
Figure 2. Hyperkeratoses & Palmoplantar Hyperkeratoses are examples of Arsenic Poisoning. (Kumar 2015)
Health Effects of Stage 2 disinfectant and byproducts:
Disinfectants and byproducts (DBPs) are made when chlorine reacts with the natural organic materials in water. A good example of this is whenever we clean swimming pools with chlorine. Disinfecting drinking water is a required step for water treatment that is enforced by the law to protect public health (CDC 2022). This method is processed by using a type of disinfectant for a specific system and adding it to the water source to form disinfection byproducts. Chlorine is added to drinking water as it can kill waterborne bacteria and viruses and it preserves the water, but since this can interact with organic materials some residues are actually a big concern to people’s health (Minnesota DOH 2019). Exceeding maximum contaminant levels of DBPs by drinking can increase the risk of cancer, experience liver damage, and decrease system activity (CDC 2022).
MCL(maximum contaminants levels): 0.800 ppb
MCLG (maximum contaminants goal): 0.010 ppb
(EPA 2022).
- Brain & nervous system: Impaired cognitive development in infants and young children (EPA 2022).
- Eyes & Nose: Irritation (EPA 2022).
- Stomach: Discomfort (EPA 2022).
- Lungs, Liver, Reproductive, Cardiovascular, Skin, Renal, Bladder, and Urinary Tract: Different kinds of cancers (EPA 2022).
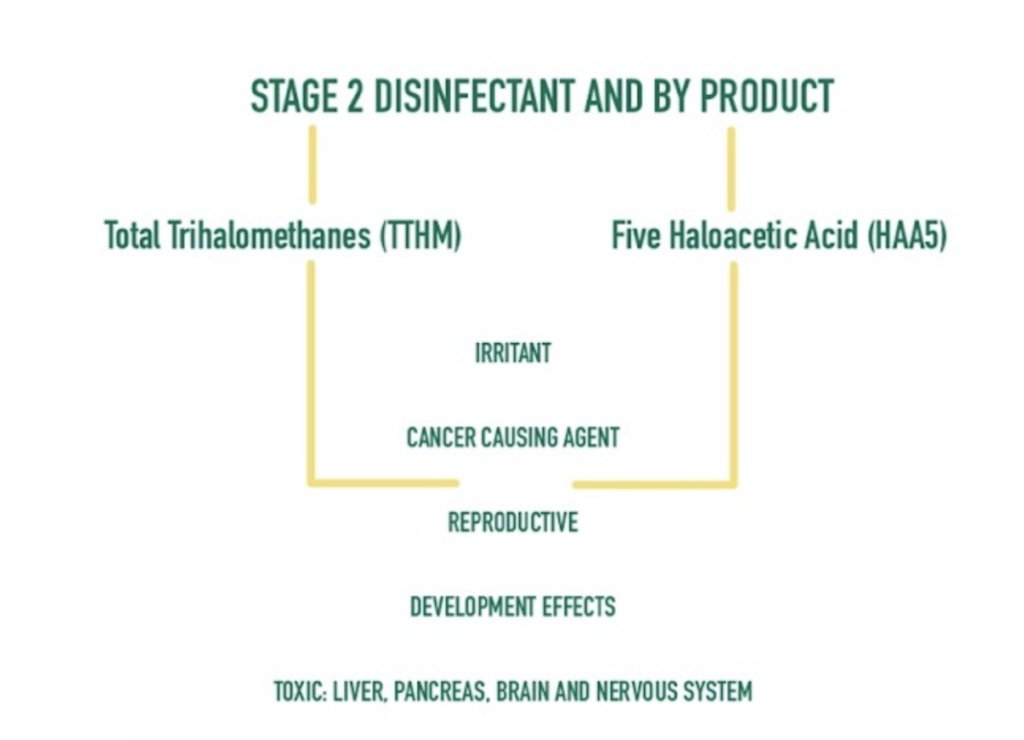
Figure 3. Two major types of disinfectants and by-products and their harmful effects. Figure by Shaina Llamas
Actions to Remedy Violation in Vulnerable Communities
Communities of color, low-income, and non-native English speakers are disproportionately impacted by drinking water violations and contamination often due to overburdened and underfunded water systems (Fedinick et al. 2019). The water systems face these difficult conditions because of long-standing social and political decisions rooted in institutionalized racism. The lack of infrastructure and funding in these areas highlights the importance of environmental justice and the need to focus funding to strengthen and support these water systems to prevent future contamination and protect human health equally in the United States. Identifying and funding Environmental Justice Communities with grants is an important step to creating equity in drinking water (Fedinick et al. 2019). With these grants, overburdened water systems could address underlying causes for violations including water contamination.
In addition to funding, the EPA and states should hold water systems accountable for violations and improve enforcement of SDWA. Enforcement should include assistance with implementation, and educational action plans to solve/prevent violations (Fedinick et al. 2019). These are just a few ways to improve water system quality control, but they are a starting point to ensure communities already faced with a disproportionate amount of environmental hazards can safely and confidently rely on their drinking water.
References
Bae J, Lynch MJ. 2022. Ethnicity, Poverty, Race, and the Unequal Distribution of US Safe Drinking
Water Act Violations, 2016-2018. The Sociological Quarterly.:1–22. doi:10.1080/00380253.2022.2096148.
Disinfection By-products (DBPs) Factsheet. 2022 Jul 18. United States: CDC; [accessed 2022 Nov 13]. https://www.cdc.gov/biomonitoring/THM-DBP_FactSheet.html.
Disinfection and Disinfection Byproducts Fact Sheet. 2019 Sept 5. Minnesota (US): Department of Health; [accessed 2022 Nov 13]. https://www.health.state.mn.us/communities/environment/water/factsheet/ddbp.html.
[EPA] United States Environmental Protection Agency. 2000. The public notification rule: a quick reference guide. [cited 2022 Oct 31]. Available from: https://nepis.epa.gov/Exe/ZyPDF.cgi?Dockey=P100529C.txt#_ga=1.47005794.472891366.1423060476
[EPA] United States Environmental Protection Agency. 2021. Drinking water requirements for states and public water systems. Chemical contaminant rules. [cited 2022 Oct 31]. Available from: https://www.epa.gov/dwreginfo/chemical-contaminant-rules
[EPA] United States Environmental Protection Agency. 2022. Safe drinking water act (SDWA) resources and FAQs. [accessed 2022 Oct 31]. https://echo.epa.gov/help/sdwa-faqs
Fawkes L, Sansom G. 2021. Preliminary Study of Lead-Contaminated Drinking Water in Public Parks—An Assessment of Equity and Exposure Risks in Two Texas Communities. International Journal of Environmental Research and Public Health. 18(12):6443. doi:10.3390/ijerph18126443.
Fedinick KP, Taylor S, Roberts M, Moore R, Olson E. 2019. Watered down justice. Natural Resource Defence Council. Report No: R:I0-09-A
Hallisey E, Flanagan B, Kolling J, Lewis B. A social vulnerability index (SVI). CDC/ATSDR. U.S. Department of Health & Human Services. Available from: https://svi.cdc.gov/Documents/Publications/CDC_ATSDR_SVI_Materials/SVI_Poster_07032014_FINAL.pdf
James KA, Marshall JA, Hokanson JE, Meliker JR, Zerbe GO, Byers TE. 2013. A case-cohort study examining lifetime exposure to inorganic arsenic in drinking water and diabetes mellitus. Environmental Research. 123:33–38. doi:10.1016/j.envres.2013.02.005.
Kumar A, Ali Md, Rahman S Md, Iqubal A Md, Anand G, et al. (2015) Ground Water Arsenic Poisoning in “ Tilak Rai Ka Hatta” Village of Buxar District, Bihar, India Causing Severe Health Hazards and Hormonal Imbalance. J Environ Anal Toxicol 5: 290. doi: 10.4172/2161-0525.1000290
Lead poisoning and health. c2019. World Health Organization; [accessed 2022 Nov 14]. https://www.who.int/news-room/fact-sheets/detail/lead-poisoning-and-health.
San Luis, CO | Data USA. datausaio. [accessed 2022 Nov 15]. https://datausa.io/profile/geo/san-luis-co#:~:text=Poverty%20by%20Age%20and%20Sex&text=31.1%25%20of%20the%20population%20for.
US EPA. 2018 Jul 27. Chemical Contaminant Rules | US EPA. US EPA. https://www.epa.gov/dwreginfo/chemical-contaminant-rules.
US EPA. 2018 Mar 23. Basic Information about Lead in Drinking Water | US EPA. US EPA. https://www.epa.gov/ground-water-and-drinking-water/basic-information-about-lead-drinking-water.
Provide Feedback